5 Metrics to Watch When Comparing Backtest Results — Return, Max Drawdown, Sharpe Ratio, and More
April 2026
“Just pick the one with the highest return” — this approach almost always runs into problems in real trading.
Even with the same +50% total return, a strategy that reaches it via a -10% drawdown feels completely different from one that passes through -35% along the way. The psychological load and the likelihood you’ll actually stick with it differ enormously. This article walks through the metrics shown in QuanTest’s comparison view and how to read them.
Why Return Alone Isn’t Enough
Cumulative return is a result — an indicator of a strategy’s overall quality — but the path to that result varies widely.
| Strategy | Cumulative return | Max drawdown | Trade count |
|---|---|---|---|
| A | +50% | -10% | 30 |
| B | +50% | -35% | 30 |
| C | +50% | -10% | 200 |
All three reach the same return, but B endures a 35% drop along the way, and C’s high trade count exposes it to more transaction cost. The emotional burden and cost structure differ dramatically.
Key Metrics and Their Meaning
The main metrics shown in QuanTest’s comparison view:
Cumulative Return
Total change in capital over the period. It’s the first thing most people look at, but it’s insufficient as a sole judgment criterion.
Max Drawdown
The largest peak-to-trough decline during the period. A strategy with a deep drawdown is one where you’ll likely think “I should stop” at some point during live trading. This directly maps to your risk tolerance.
Sharpe Ratio
Return divided by risk (standard deviation) — more precisely, excess return over the risk-free rate divided by standard deviation. It captures “return per unit of risk.” Typically, Sharpe > 1.0 is considered efficient, but what counts as good varies by asset class and period.
Trade Count and Average Holding Period
High trade counts mean higher exposure to commissions and slippage. Backtests often simplify transaction costs, so real-world results usually come in worse than backtested.
Win Rate and P&L per Trade
A high win rate doesn’t matter if a single large losing trade wipes out the gains. Win rate and average P&L must be read as a pair.
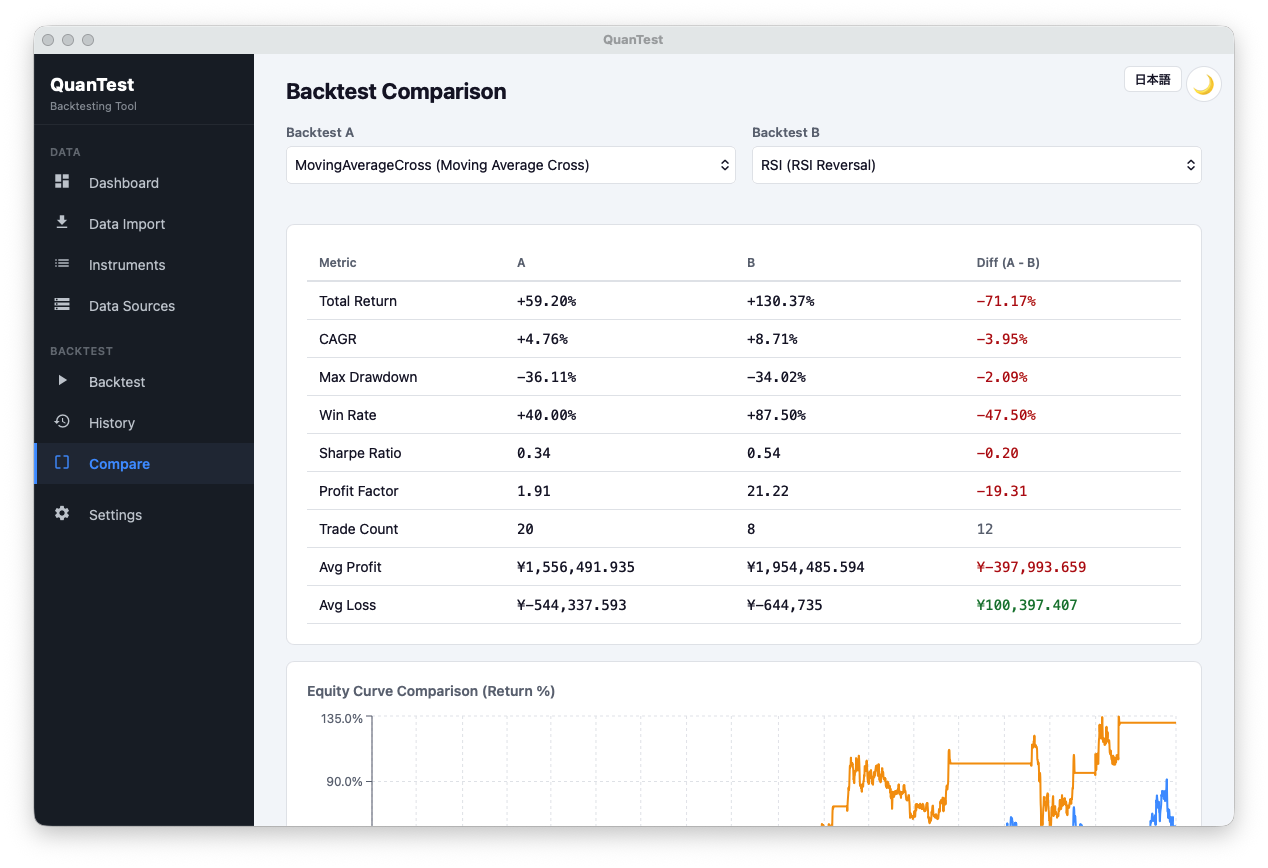
In the comparison above, moving average cross (A) shows +59.20% total return, 40.00% win rate, 20 trades, while RSI contrarian (B) shows +130.37%, 87.50% win rate, 8 trades. Judging by return and win rate alone, B looks overwhelmingly superior — but missing the fact that sample size (trade count) differs by 2.5× leads to a wrong conclusion. B’s profit factor of 21.22 is attractive as a number, but it’s computed from just 8 trades, so it’s heavily influenced by chance. Max drawdowns are essentially equivalent (A: -36.11% / B: -34.02%). The essence of comparison is coolly examining where differences emerge under the same conditions — not picking the flashiest number.
Free · No signup · Data stays on your device
The Right Mindset for Comparing
Strategy comparison is not about “finding the strongest strategy.” It’s about finding the strategy that matches your risk tolerance and operational style. Even with the same return, strategies with smaller drawdowns tend to be easier to stick with.
Also, rankings can flip just by changing the backtest period. Don’t judge by one window alone — compare across multiple regimes (bull, bear, sideways).
Note: picking “the single best-performing setting” leads directly to overfitting. We recommend reading that piece before running comparisons. And if you’re only testing against currently-listed instruments, factor in survivorship bias and discount results accordingly.
Try It in QuanTest
QuanTest’s strategy comparison feature lets you view multiple strategies side by side on a single screen. Running several strategies against the same instrument and period clarifies your evaluation axes instantly.
Free · No signup · Data stays on your device
This article is for educational purposes. It does not guarantee the profitability of any strategy or future performance. Investment decisions are your own responsibility.