Does Bollinger Band Breakout Actually Work? Trend-Following and Squeeze Variants
April 2026
Most beginner guides present Bollinger Bands as a mean-reversion tool: “sell at +2σ, buy at −2σ.” But in strongly trending markets, prices often “walk the band” — and fading those moves can lead to heavy losses. A more practical use in trending regimes is to enter in the direction of the break.
This article covers the assumptions behind the breakout interpretation, and a squeeze-based variant that filters for volatility expansion.
Core Assumption
Bollinger Bands are built from a moving average and standard deviation. The ±2σ bands cover roughly 95% of observations if returns are normally distributed — but real stock returns have fat tails, so prices break ±2σ more often than the theory predicts.
The breakout interpretation reads a ±2σ move as “abnormal price action → possible trend birth,” and enters in the same direction.
Two Entry Styles
| Variant | Entry | Market regime |
|---|---|---|
| Simple breakout | Close above +2σ | Early stage of a new trend |
| Squeeze breakout | Band width at N-day minimum, then breakout | Volatility expansion phase |
The squeeze variant is based on the heuristic that low volatility precedes high volatility. Fewer entries, but fewer false signals.
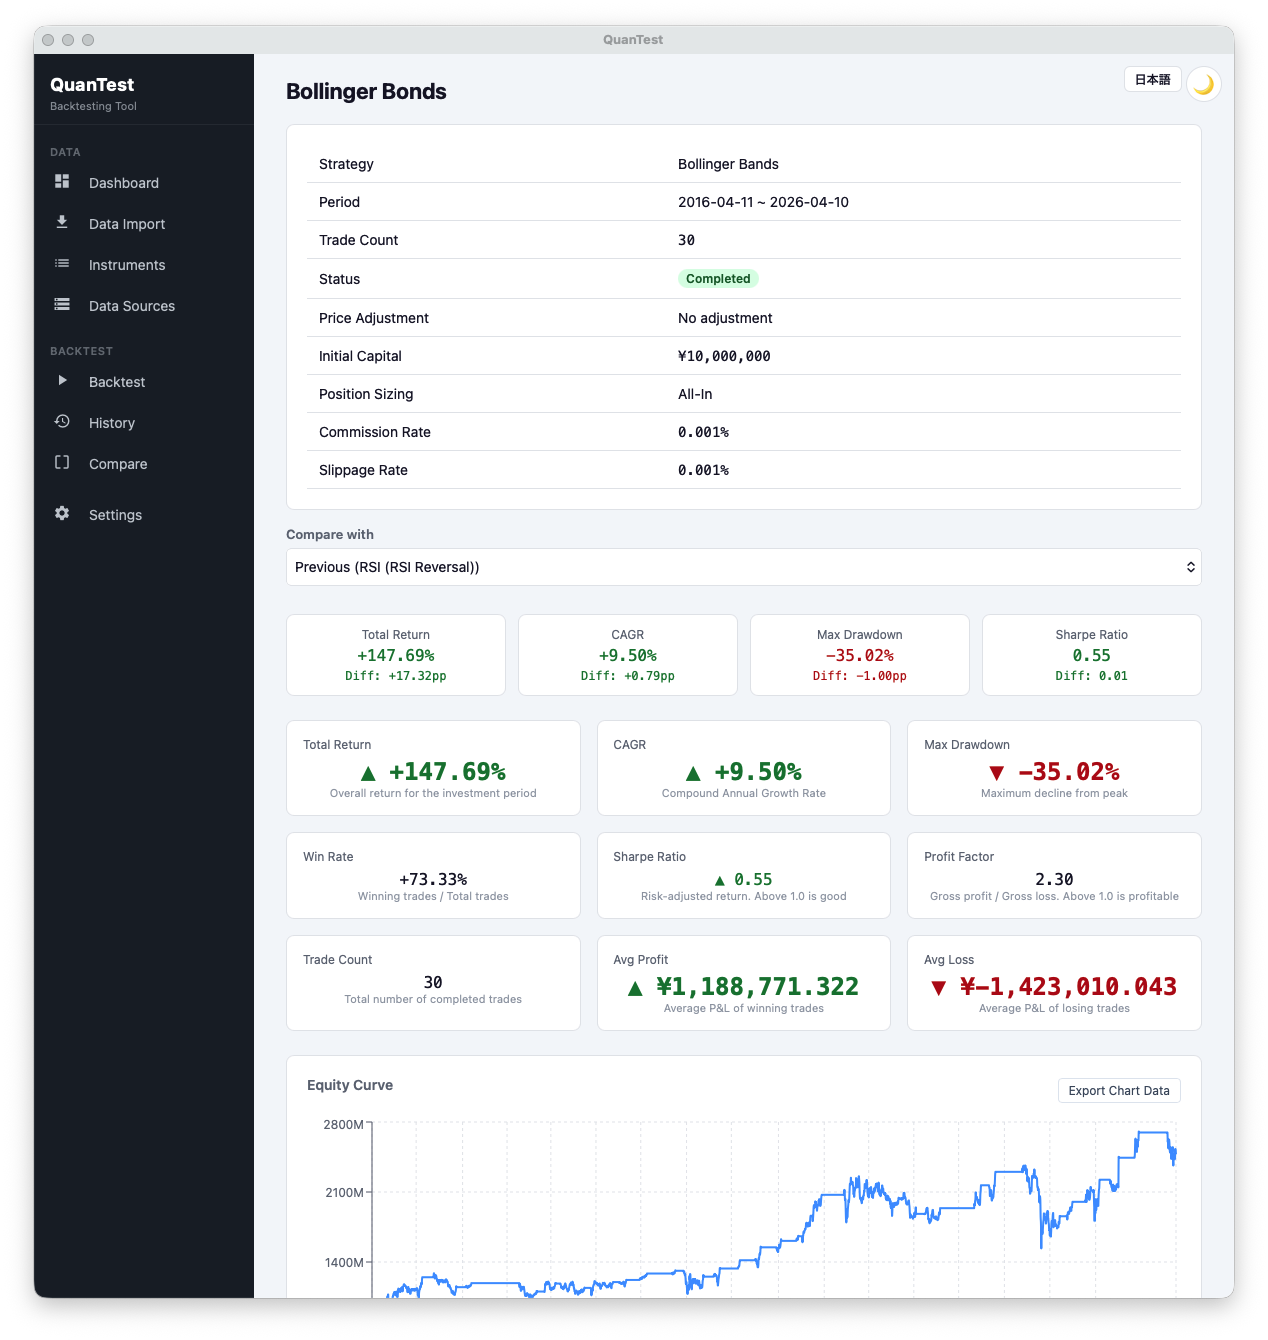
In the 10-year run above (2016-04 to 2026-04, 30 trades), total return is +147.69%, CAGR +9.50%, profit factor 2.30 — solidly positive. The interesting wrinkle: win rate is 73.33%, yet average win (¥1,188,771) < average loss (¥1,423,010). That’s the opposite shape from a typical trend-follower — the strategy earns from hit frequency, not from outsized wins. The consequence is structural fragility: if the hit rate drops even 10–20pp, the P&L inverts quickly. Read the -35.02% max drawdown as a reminder of that same asymmetry.
What to Check in Backtests
- Average holding period: whether the strategy catches band walks
- Max drawdown: appears during failed breakouts / whipsaws
- Net P&L after fees: large trade counts make costs matter
For how to read these metrics, see the 5 metrics to watch when comparing backtest results.
Pitfalls
Watching only ±2σ tends to pick up false breaks while the band is already wide. Confirming with volume or ATR filters reduces whipsaws.
The squeeze threshold (how many days back is “minimum”?) also changes signal counts dramatically. This sensitivity invites overfitting, so always test across multiple thresholds.
Try It in QuanTest
QuanTest ships with Bollinger Band strategies as presets. Start with the standard 20-day period and run σ multipliers between 1.5 and 2.5, comparing breakout and mean-reversion variants side by side.
Free · No signup · Data stays on your device
This article is for educational purposes. It does not guarantee the profitability of any strategy or future performance. Investment decisions are your own responsibility.