Reading MACD Signals: Can the Histogram Front-Run Trend Reversals?
April 2026
MACD (Moving Average Convergence Divergence) compares the difference of short- and long-period EMAs against a signal line. Because it uses EMAs, it reacts faster than a simple moving average cross, and the histogram visualizes momentum acceleration and deceleration.
The trade-off: that same speed picks up noise. Running MACD on raw signal crosses alone produces many whipsaws.
Three Ways to Use MACD
| Style | Entry | Character |
|---|---|---|
| Signal cross | MACD crosses above signal line | Fast, but many false signals |
| Zero-line cross | MACD crosses above zero | Slower, clearer direction |
| Histogram reversal | Histogram stops shrinking, starts expanding | Catches momentum inflections |
A zero-line cross is essentially a short/long EMA cross, so it behaves much like the moving average cross strategy.
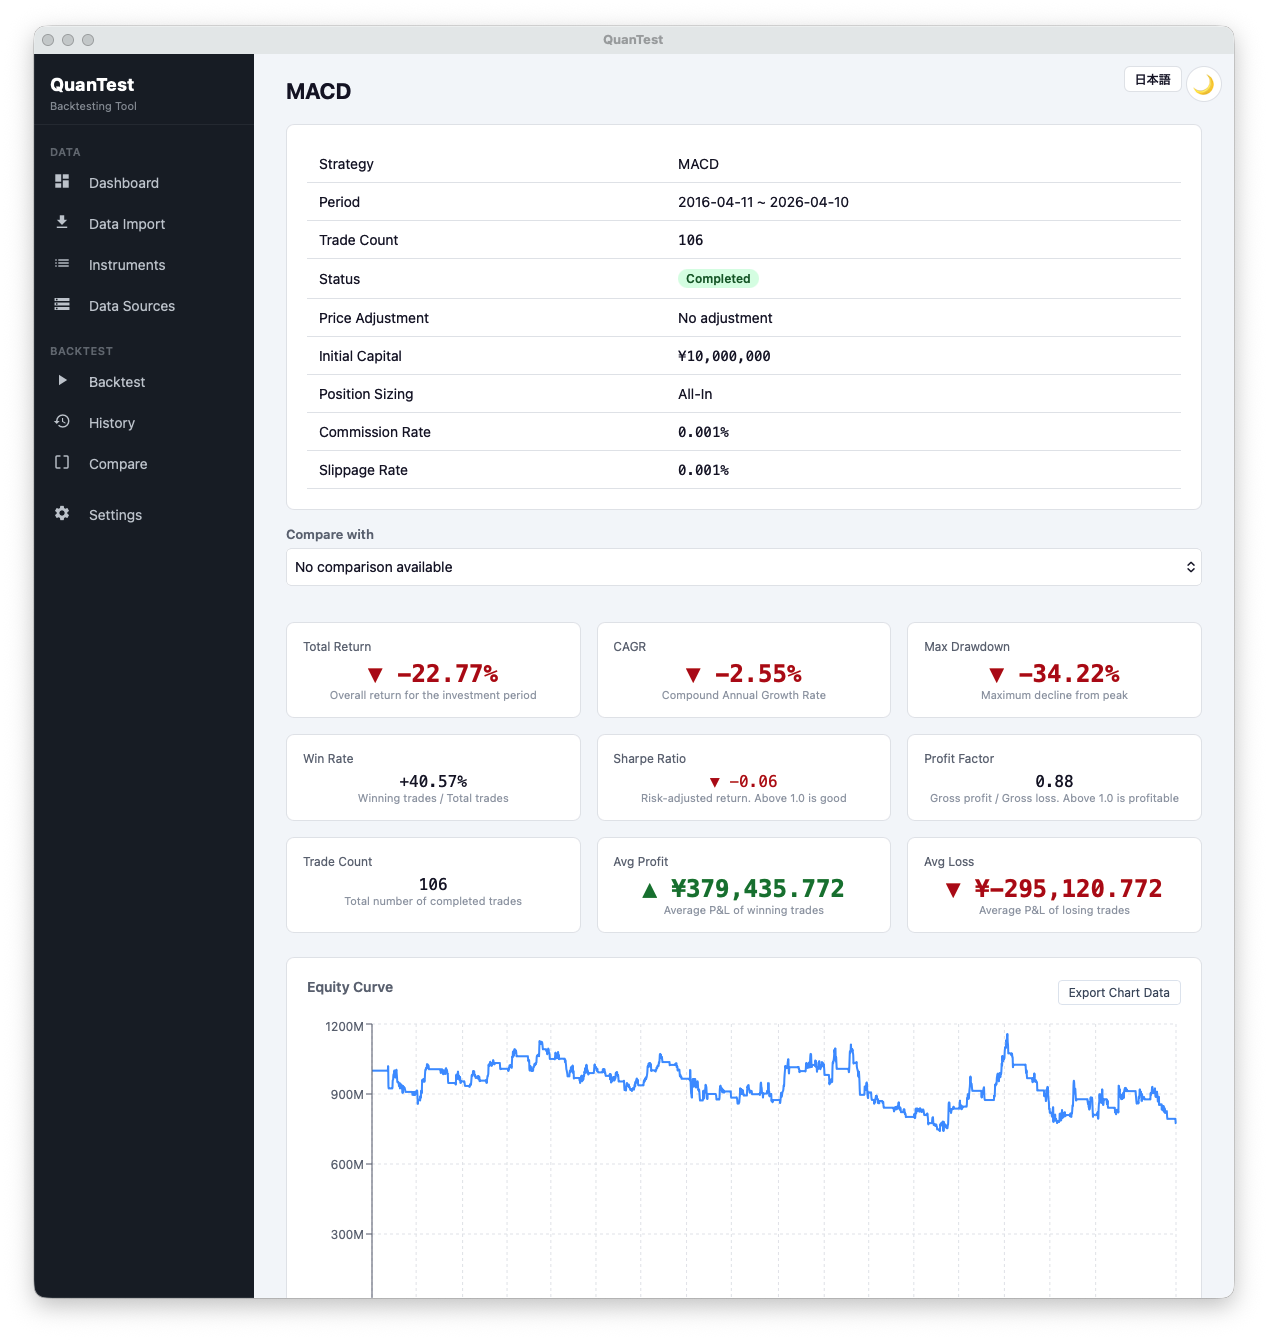
Over the same 10-year window (2016-04 to 2026-04), MACD generates 106 trades — more than three times the other strategies in this series — and finishes negative: CAGR -2.55%, profit factor 0.88, win rate 40.57%. Sharpe is effectively flat at -0.06. Even with fees and slippage set to a tiny 0.001%, the strategy is in the red. That tells you MACD’s speed advantage comes straight back as noise pickup. Read this as a case for pairing it with a trend filter or other confirming system rather than running it bare.
What to Check in Backtests
- Win rate × profit factor combo. MACD-based systems often have low win rates but capture trends when they come
- Holding period distribution. Very short holds are a sign you’re riding histogram jitter, not signal
- Max drawdown. Zero-line cross variants tend to run deep drawdowns
Pitfalls
The default MACD parameters (12, 26, 9) have historical roots in U.S. daily equity data. They aren’t necessarily optimal for Japanese daily equities. Any parameter change should be evaluated across different instruments and periods.
Divergence (price makes a new high, MACD doesn’t) is a famous signal but hard to codify mechanically. Treat it as a visual aid, not an automated rule.
Combining with Filters
A common pattern is to layer a trend filter on top of MACD — e.g., “only allow longs when price is above the 200-day MA.” This avoids buying into weak markets.
For how to compare backtest results, see this article.
Try It in QuanTest
MACD is available as a preset in QuanTest. Start from the defaults (12, 26, 9) and adjust the short period to your instrument’s volatility. Comparing results side by side with a moving average cross also helps reveal how much MACD’s faster response actually buys you.
Free · No signup · Data stays on your device
This article is for educational purposes. It does not guarantee the profitability of any strategy or future performance. Investment decisions are your own responsibility.