Do Golden Cross and Death Cross Actually Work? Testing Moving Average Cross Strategies
April 2026
The moving average cross is one of the most famous — and most misunderstood — technical strategies. Every textbook covers it, but when you actually run a backtest, two characteristics emerge clearly:
- It tends to work in strong trending markets
- In ranging markets, it generates excessive signals, and transaction costs eat into returns
In other words, it’s not a strategy that “always works” — it’s a strategy with clear working and non-working regimes. This article walks through those assumptions and what to check when backtesting.
The Strategy’s Core Assumption
When the short-term moving average crosses above the long-term moving average (golden cross), the theory assumes the market has likely turned upward, and you enter a long position. When it crosses below (death cross), you exit or go short based on a suspected downtrend.
For this assumption to hold, prices need to be forming a sustained trend. In ranging markets where prices oscillate up and down, the moving averages cross frequently, generating whipsaw signals that erode returns through transaction costs.
What the Parameters Mean
A moving average cross strategy uses two periods: short and long. Common pairs include 5/25, 25/75, and 50/200. Changing the ratio dramatically changes the strategy’s character.
| Pair | Target horizon | Responsiveness |
|---|---|---|
| 5 / 25 | Short–medium term | Fast (many signals) |
| 25 / 75 | Medium term | Moderate |
| 50 / 200 | Long term | Slow (few signals) |
Smaller short periods produce more signals but react more to noise. Larger long periods produce more stable signals but delay trend detection.
How to Read Backtest Results
When you run a backtest in QuanTest, you see return, max drawdown, trade count, and win rate. For moving average cross strategies, pay attention to:
- Trade count: If extremely high, the strategy is likely generating false signals in ranging markets
- Max drawdown: Often appears when the strategy misses a trend reversal
- Win rate vs. average P&L per trade: Average P&L matters more. A strategy with a 40% win rate can still be profitable overall if winning trades are large enough
For a deeper dive into how to read each metric, see the 5 metrics to watch when comparing backtest results.
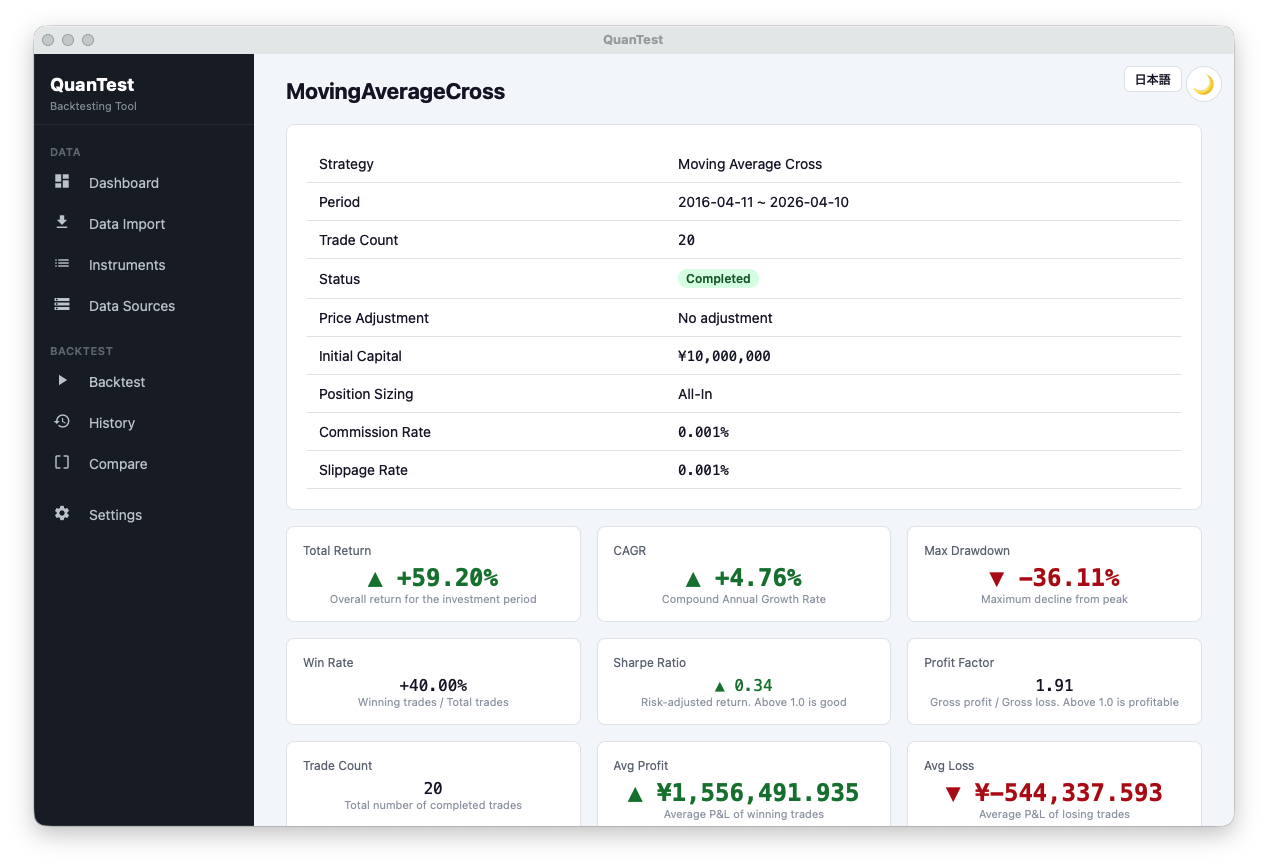
In the result above, total return is +59.20% and CAGR is +4.76%, but the win rate is only 40.00% — meaning more losing trades than winning ones — and max drawdown reaches -36.11%. What keeps it net positive is the profit factor of 1.91: the average winning trade (¥1,556,491) is well above the average losing trade (¥-544,337). This illustrates the key insight for reading moving average cross results: average P&L per trade matters more than win rate. Don’t panic at a low win rate — check whether the structure captures large trends when they appear.
Free · No signup · Data stays on your device
Pitfalls
Backtest results for moving average cross strategies shift dramatically just by changing the instrument or period. The reasoning “it worked well on X, so it should work elsewhere” is dangerous. Always verify stability across multiple instruments and multiple periods.
When a specific parameter set produces exceptional results, read our piece on spotting overfitting first and run a sensitivity analysis.
Also, moving averages by definition take averages of past prices, so they structurally lag trend reversals. This lag is intrinsic to the strategy — parameter tuning can’t eliminate it.
Complementary Strategies
The weakness in ranging markets can be partially offset by mean-reversion indicators. RSI contrarian strategies, for example, are designed around ranging markets — a mirror-image approach. Switching between them based on market regime is one practical adaptation.
Try It in QuanTest
QuanTest ships with moving average cross as a preset strategy. Changing the short and long parameters while running backtests across multiple instruments is the fastest way to feel the strategy’s character.
Running it on your own data is dramatically faster than reasoning from textbooks.
Free · No signup · Data stays on your device
This article is for educational purposes. It does not guarantee the profitability of any strategy or future performance. Investment decisions are your own responsibility.