RSI Contrarian Strategy Thresholds (30/70, 25/75, 20/80) and Their Pitfalls — A Backtesting Guide
April 2026
“Buy when RSI drops below 30, sell when it rises above 70” — most traders have heard this rule, but surprisingly few have thought through which market regimes it works in and which it doesn’t.
RSI contrarian strategies lead directly to the classic “catching a falling knife” failure the moment their core assumption breaks. This article maps the conditions that make it work, the pitfalls, and what to focus on when backtesting in QuanTest.
What RSI Actually Measures
RSI (Relative Strength Index) is an oscillator computed from the ratio of average gains to average losses over a window:
RSI = 100 - (100 / (1 + RS))
RS = Average gain / Average loss
The more up-days (and the larger the gains) in the window, the closer RSI gets to 100. More down-days push it toward 0. The default is usually a 14-day window, but shortening it (e.g., 7 days) makes it more reactive, and lengthening it (e.g., 21 days) smooths it out.
The Contrarian Assumption
RSI contrarian trading rests on the idea of mean reversion: prices may overshoot short-term, but they tend to return to an average level. For this assumption to hold:
- No strong one-directional trend (i.e., a ranging or consolidating market)
- Some meaningful volatility (too little, and RSI never reaches the thresholds)
- Enough liquidity (thin volume means you can’t execute at your intended timing)
Conversely, in a strong downtrend, RSI can fall below 30 and keep falling — no bounce in sight. That’s the “catching a falling knife” failure.
To gauge trend strength, it’s standard practice to combine RSI with a trend-following indicator like a moving average cross.
Choosing Thresholds
RSI 30/70 is traditional, but it’s not absolute. Depending on the instrument and market environment, 20/80 can work better.
| Thresholds | Signal frequency | Per-signal conviction |
|---|---|---|
| 30 / 70 | High | Moderate |
| 25 / 75 | Somewhat lower | Somewhat higher |
| 20 / 80 | Low | Higher (but fewer opportunities) |
Stricter thresholds reduce trade count, but each entry happens at a more extreme level, so mean reversion is comparatively more likely.
What to Watch in Backtests
When backtesting RSI contrarian in QuanTest, focus on:
- Trade count: If thresholds are too strict, you might see only a handful of signals in 10 years. Too few trades destroys statistical reliability
- Longest losing streak: In trending markets, RSI contrarian can fail many times in a row. Check how deep the worst streak is
- Median holding period: Is the average holding time until RSI recovers consistent with your expectation?
Picking “the settings with the best numbers” by iterating thresholds is a classic path to overfitting, so always pair it with sensitivity analysis.
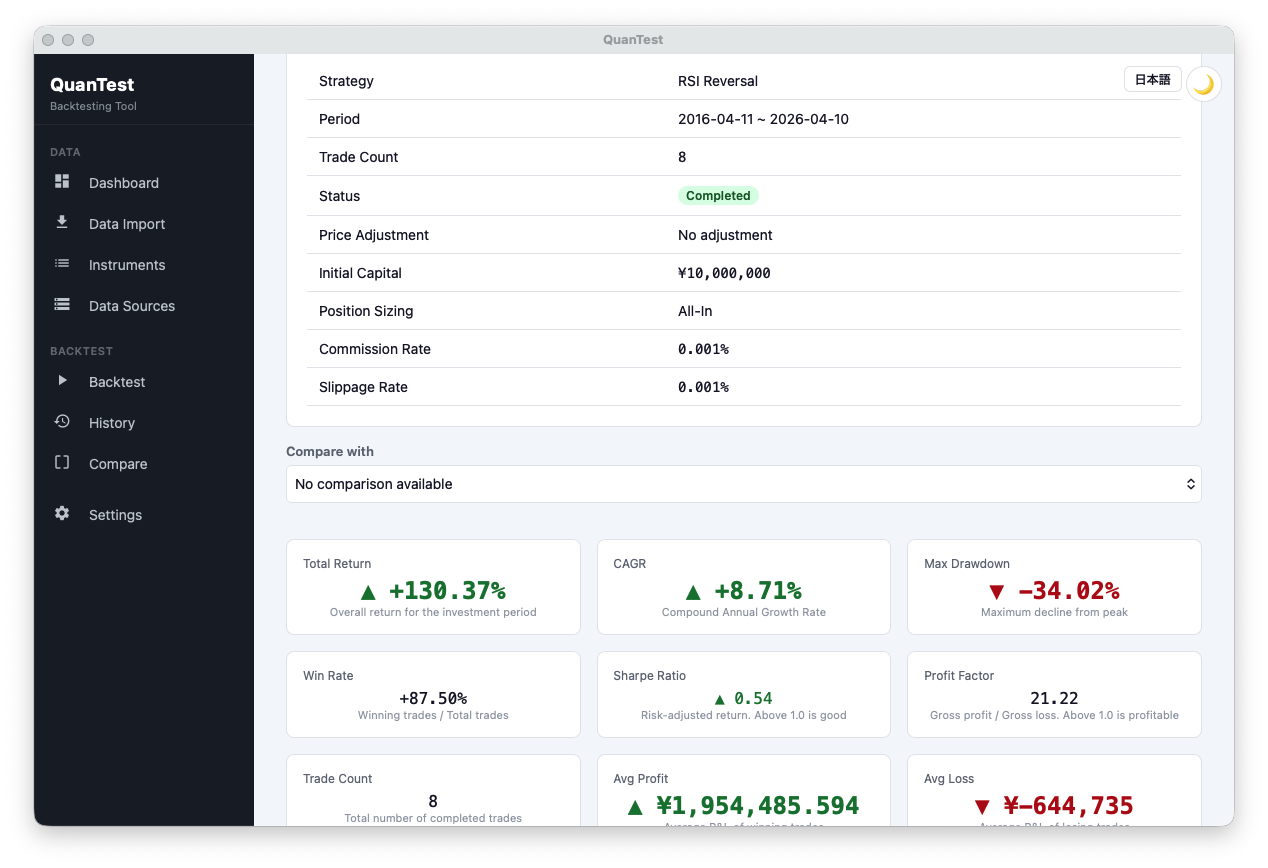
The result above shows total return +130.37%, CAGR +8.71%, win rate 87.50%, and profit factor 21.22 — numbers that look exceptional at first glance. But notice: trade count is only 8, max drawdown reaches -34.02%, and Sharpe ratio is 0.54. Sample sizes this small are heavily influenced by chance. When the numbers look flashy, suspect the trade count and dispersion first — this is the core discipline for reading any backtest, not just RSI.
Free · No signup · Data stays on your device
Gauging Applicability
RSI contrarian does not work for every instrument and every period. Approach it with the premise that “what worked in the past doesn’t guarantee the same result in the future” and verify stability across multiple market regimes — uptrend, downtrend, and range — before drawing conclusions.
Try It in QuanTest
QuanTest ships with RSI contrarian as a preset strategy. Vary the thresholds and periods, and run backtests on your own instruments.
Running real data gives you a much faster sense of where the strategy works and where it doesn’t than reasoning alone.
Free · No signup · Data stays on your device
This article is for educational purposes. It does not guarantee the profitability of any strategy or future performance. Investment decisions are your own responsibility.