Donchian Channel Breakout: Backtesting the Turtle Traders' Core Strategy
April 2026
The Donchian channel breakout was popularized by Richard Donchian and cemented in trading lore through the Turtle Traders experiment. The rule is brutally simple: buy when price takes out the N-day high; exit when it breaks the M-day low. Many CTAs still use this as their base layer.
Classical Rules
| Component | Example |
|---|---|
| Entry | Close above 20-day high, enter next open |
| Exit | Close below 10-day low, exit next open |
| Risk | Risk 1–2% of capital per trade |
Buying new highs feels counterintuitive, but the underlying thesis is that a new high means most prior participants are in profit and selling pressure weakens — a plausible ignition point for a trend.
Does It Work on Equities?
Donchian systems were historically tested on futures. They can still work on individual equities, but results skew to certain instrument types.
- Volatile names (small-cap growth, thematic)
- Liquid enough to avoid execution slippage
- Earnings-gap behavior that doesn’t break the signal
On low-volatility large caps, breakouts often reverse and produce whipsaws.
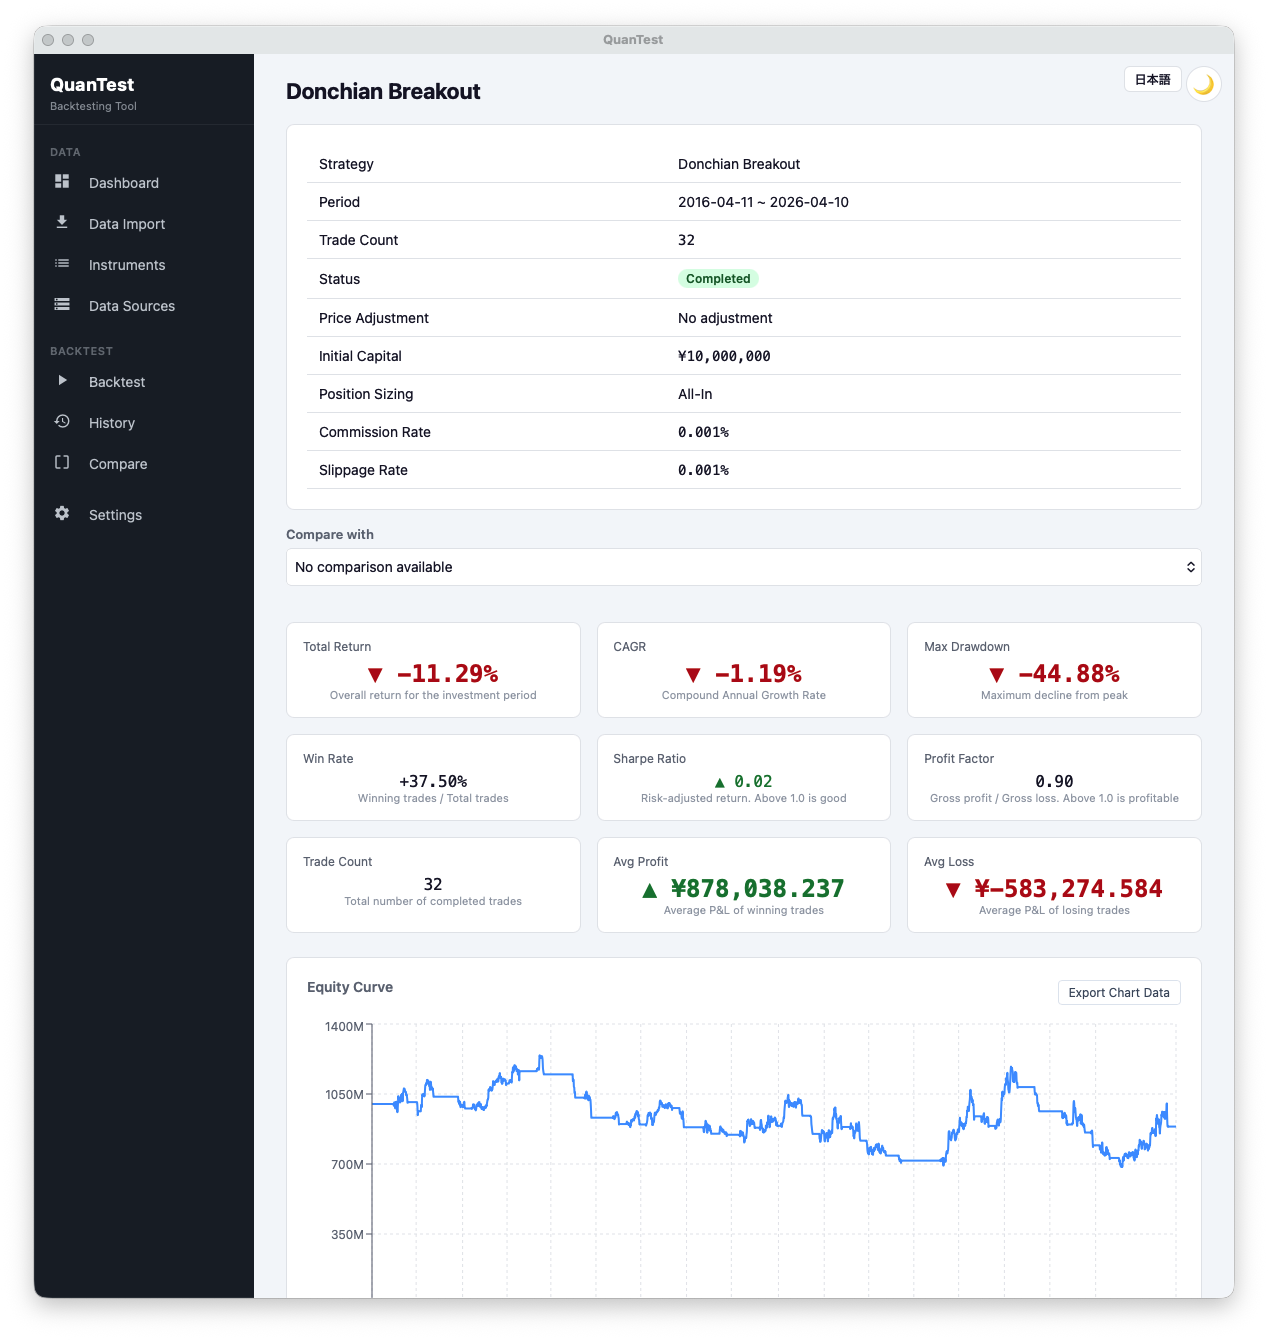
Over this 10-year run: 32 trades, 37.50% win rate, avg win ¥878,038 vs avg loss ¥583,274 — a textbook trend-follower shape where winners are bigger than losers. Yet CAGR is -1.19%, profit factor 0.90, and max drawdown reaches -44.88%. Even a structurally sound trend-following design can end a 10-year window in the red if the instrument universe simply didn’t produce enough clean trends. The next step is to separate “this is bad design” from “this was an unlucky period” — that’s exactly what walk-forward and Monte Carlo are for.
What to Check in Backtests
- 30–40% win rate is acceptable. Like the moving average cross, trend-following earns from average P&L, not from hit rate
- Max drawdown. Long losing streaks are mentally hard, not just financially
- Holding period. Too long = missed next signal; too short = not capturing the trend
Pitfalls
Donchian systems are known to be relatively parameter-insensitive, but N=20 isn’t sacred. Scan 15–55 and check the result surface is smooth. An isolated spike at one N is a red flag for overfitting.
Also, breakout systems are highly exposed to survivorship bias. Testing on a universe that excludes delisted tickers flatters the results. See this article for why that matters.
Try It in QuanTest
QuanTest’s preset “Breakout” strategy is built around Donchian-style N-day high / M-day low rules. Start at N=20/10 and adjust the periods based on your instrument universe’s volatility.
Free · No signup · Data stays on your device
This article is for educational purposes. It does not guarantee the profitability of any strategy or future performance. Investment decisions are your own responsibility.