Reading Your Results
Key Performance Metrics
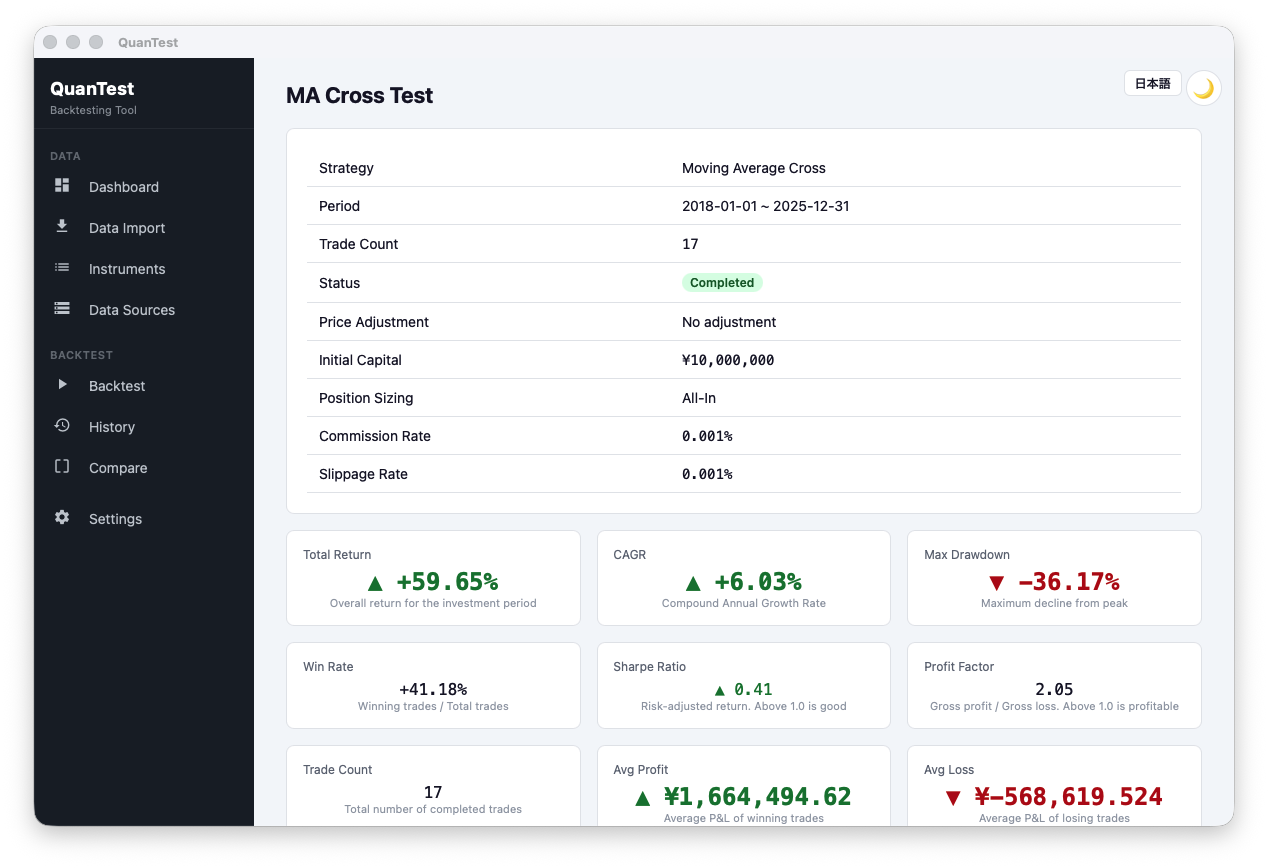
After the backtest completes, the following metrics are displayed.
Free and Pro
| Metric | Description |
|---|---|
| Total Return | Overall gain/loss as a percentage of initial capital. |
| CAGR | Compound Annual Growth Rate. Useful for comparing strategies across different time periods. |
| Max Drawdown | The largest peak-to-trough decline in portfolio value. A smaller value means lower risk. |
| Win Rate | Percentage of trades that were profitable. |
| Trade Count | Total number of buy/sell transactions during the period. |
Pro Only
| Metric | Description |
|---|---|
| Sharpe Ratio | Return per unit of risk. A value above 1.0 is a common benchmark. |
| Profit Factor | Total profit ÷ total loss. Above 1.5 is generally considered solid. |
| Avg Win / Avg Loss | Average gain and loss per trade. Avg Win > Avg Loss is ideal. |
Reading the Charts
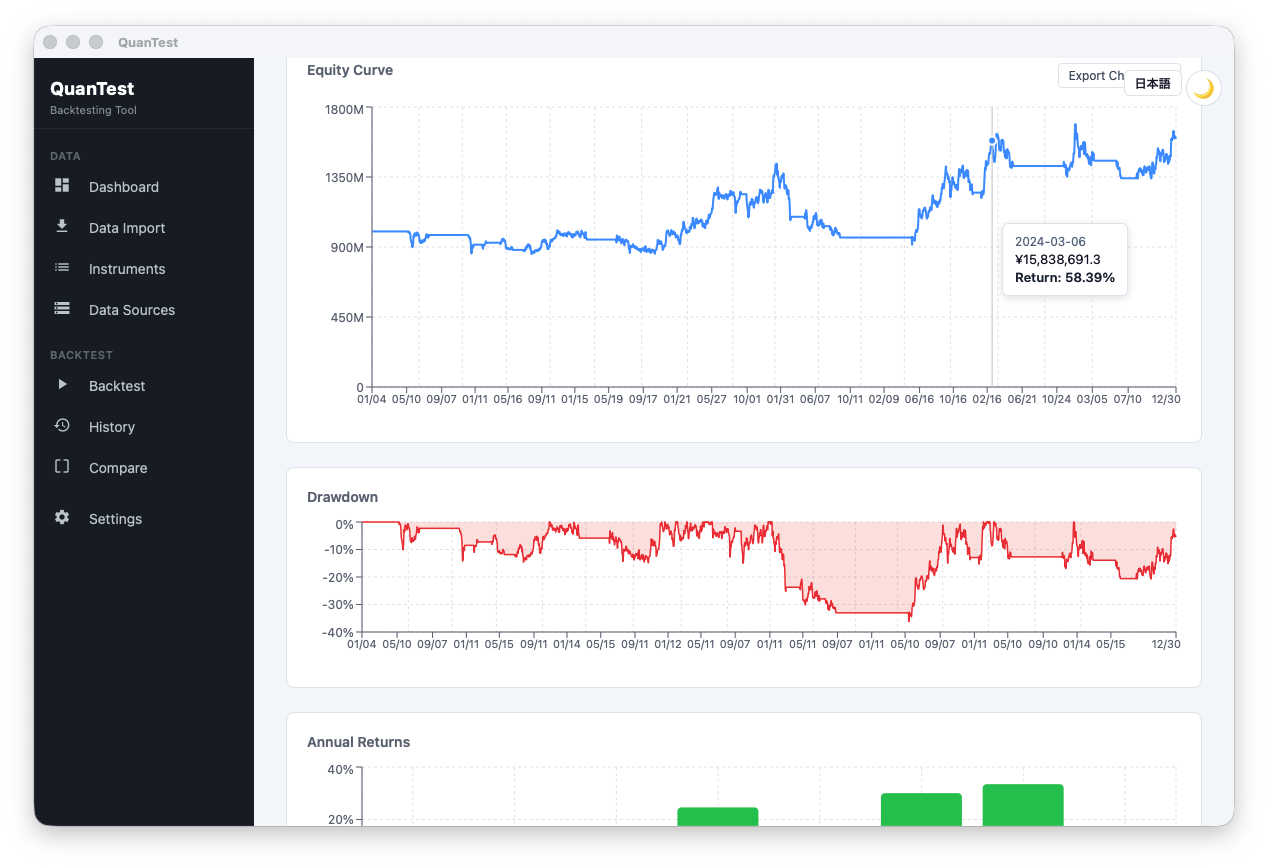
Portfolio Value Chart
Shows how your portfolio value changed over time, indexed to 100% at the start. A steadily rising curve is ideal. Sharp drops represent drawdown periods.
Drawdown Chart
Shows the decline from the most recent peak over time. Deeper means a larger loss; wider means it took longer to recover.
Annual Return Bar Chart
Shows the return for each calendar year. Even if some years are negative, check whether the long-term trend is positive.
Trade List
Every trade is listed with full entry and exit details.
| Column | Description |
|---|---|
| Direction | Buy / Short (short sell) |
| Entry Date | Date the position was opened |
| Exit Date | Date the position was closed |
| Entry Price | Purchase price (before fees) |
| Exit Price | Sale price (before fees) |
| Qty | Number of shares |
| P&L | Profit or loss for the trade (including fees and slippage) |
The trade list can be exported as a CSV file for use in external tools.
Acting on Results
Re-run with Different Parameters
Click “Re-run with Different Parameters” to adjust settings while keeping the same instrument and date range.
Re-run with Same Settings
Re-runs the backtest with exactly the same configuration.
Managing History
The History page lets you browse all past backtest results. You can search by name, ticker, or strategy, and add tags and notes.
Free plan limit: You can save up to 3 backtests. When you run a 4th, the oldest is overwritten. Upgrade to Pro for unlimited history.